|
Kinetic energy |
= 1/2 m v2 |
|
Potential energy |
= m g h |
|
Total energy |
= kinetic + potential energy |

Please note:
This is a fairly nice lab report of an experiment that should provide a guide to you for producing your own lab reports. It was written by students who took this course.Your report should usually contain the following ingedients:
- Introduction of the purpose of the experiment
- Description of the measurement procedure
- Listing of the data you obtained, with formulas used in extraction of these data.
- Graphic representation of your data and possible comparison to theoretical predictions
- Discussion of possible errors and uncertainties
- Conclusion with clearly stated outcomes of the experiment
In this experiment we used the PASCO Science Workshop Equipment, KaliedaGraph, Microsoft Word and Excel, and a golf ball in order to investigate the potential, total, and kinetic energy of a ball that bounces off the ground. Our purpose is to determine as precisely as possible how much energy is lost in the bounce of the ball and to observe how well the energy is conserved throughout the flight. We believe that if the air resistance is neglected, then the ball that is dropped should conserve total energy as it falls. However, because the ground is not a totally elastic surface, some of the energy will be lost. We will therefore observe the total energy as a function of time so as to determine whether the energy is lost in the actual bounce of the ball into an inelastic surface, or due to air friction.
First we needed to set up the equipment which contained a motion sensor and a golf ball. The golf ball was weighed and the height of the sensor, h, was measured with the digital meter on the sensor. The distance we are actually measuring, though, is the distance between the ground and the sensor because we are subtracting the distance from the motion sensor to the ball. We need to correct for the diameter of the ball because the distance from the motion sensor to the top of the ball is what the sensor is measuring, not the distance from the sensor to the ground. In order to do this we subtracted the diameter of the ball from h.
Now that we were ready to begin the experiment, we held the ball below the sensor enough so its position is recorded and we began the recording and let the ball drop. After a few practice drops, we chose the ‘best’ data that allowed us to see a graph of d, the distance between the motion sensor and the ball versus time. A graph was created in Science Workshop displaying our data. More graphs and tables were then created.
Formulas:
|
Kinetic energy |
= 1/2 m v2 |
|
Potential energy |
= m g h |
|
Total energy |
= kinetic + potential energy |
Kinetic energy is the energy an object has while in motion. An object loses kinetic energy each time it hits a non-elastic surface. Kinetic energy is dependent upon the mass of the object and the velocity the object is moving with. The sharp decreases at t= 1.2 and 2.0 s are where the ball hit the ground.
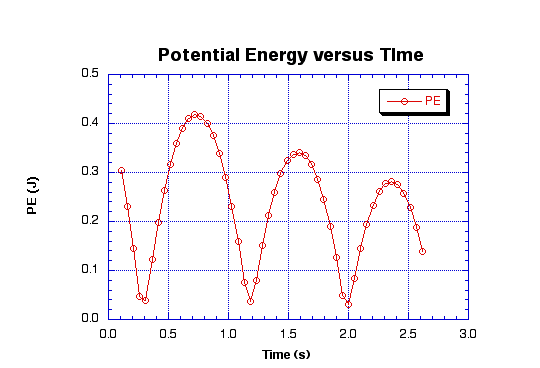
Potential energy is the possible amount of energy an object has before any movement. Potential energy is dependent upon the mass of the object, acceleration due to gravity and the height of the object. Each time the object falls it loses potential energy and each time it returns it gains potential energy. At t= 0.3, 1.2 and 2.0 s the ball hits the ground. This is because potential energy is lowest when the ball hits the ground.

The total energy is the sum of both the kinetic and potential energy. At t=0.3, 1.2, and 2.0 s the ball is striking the ground. We know this because at these times the ball has it’s lowest amount of energy. This is a step-like function because when the kinetic energy is at its peak, potential energy is at its valley, and vice versa. This creates horizontal lines when they are added.
Our purpose of the experiment was met because we were able to successfully investigate and observe kinetic, potential, and the total energy of a bouncing golf ball. From our observations, we are able to conclude that the ball loses energy each and every time the ball hits the ground and bounces back. This is especially noticeable in the graph of the total energy. In regards to air resistance versus elasticity, we concluded that the amount of energy lost through air resistance is negligible compared to the amount of energy lost through contact of the golf ball with the ground.
During the motion of the ball, kinetic energy is not being conserved but rather distributed into the ground. This energy transfers because the ground is not an elastic surface. The total energy slightly decreases also due to the inelasticity of the bounce. The Law of Conservation of Energy does hold for this case, however, because the energy is not being destroyed rather it is being transferred.
Each bounce created a total energy loss of approximately 0.9 J.
The energy was lost in the actual bounce rather than in the air. This is because if the ball bounced on an elastic surface, the energy of each bounce would be roughly equal and the ball would return to its starting height. Because the experiment did not use a perfectly elastic surface, we can be fairly sure that the bounce was the actual cause of the loss of total energy, rather than the air resistance.