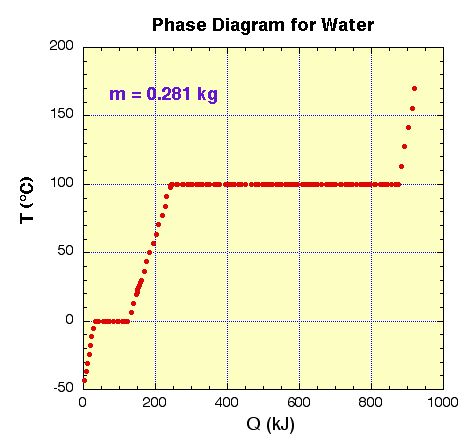
If you could avoid measurement errors, then your plot would look like the one shown below. The horizontal sections indicate the latent heats in the phase transition. Since the latent heat is
you can calculate the mass from the known values of the latent heats, L, and the values of Q that you measured from the point at which the temperature becomes constant to the point where the temperature changes again.
Alternatively, you can also extract the mass from the parts of the plot where the temeperature changes linearly with the heat inserted into the system. There
Since you know the temperature interval, DT, and the specific heat capacity, c, we can calculate the mass.